The most important financial indicators for the company Nesa Technology S.r.l. - Unique Identification Number 40278007:
sales in 2023 was
-
euro, registering a net profit of
-608
euro and having an average number of
employees.
Firma isi desfasoara activitatea in domeniul Activitati de realizare a soft-ului la comanda (software orientat client) having the NACE code 6201.
The table presents the most important indicators of the company from the Profit and Loss Account for the last 10 years of activity. The data show the company's evolution during this period, highlighting any increases or potential decreases recorded.
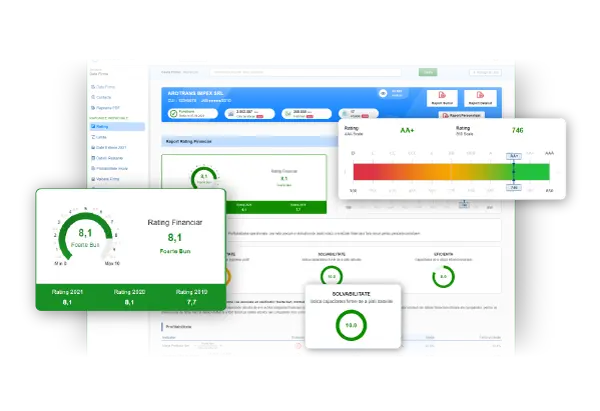
Financial Analysis Reports provide a clear and comprehensive view of a company's financial activity. In addition to presenting financial data, the reports analyze this data so that any user can understand whether the results are positive or less favorable. The Financial Rating provides an analysis based on the most important financial ratios, including liquidity, solvency, and profitability. Payment Limits represent the maximum amounts for which a company can offer goods or services on credit to its clients. The Probability of Insolvency presents the theoretical probability that a company may not be able to meet its financial obligations towards its creditors, i.e., suppliers and financial institutions.
The table presents the company's Balance Sheet structure for the last 10 years. Current Assets recorded a value of
44.534 euro in 2023 which includes Inventories of
0 euro, Receivables of
33 euro and cash availability of
44.501 euro.
The company's Equity was valued at
44.534 euro, while total Liabilities amounted to
0 euro.
Equity decreased by -608 euro, from 45.279 euro in 2022, to 44.534 in 2023.
Activate a subscription with unlimited access and get contact details for any company.
Subscriptions Financial Reports
You can check the financial situation of the companies in relation to the industry of which it is a part, credit limits and the risk of insolvency and suspension of accounts.
Recurring
- monthly payment
Pay
25,21EUR / month
NELIMITAT
Reports that can be accessed based on the subscription:
✔ Financial Rating
✔ Payment Limits
✔ Outstanding Debts
✔ Probability of Insolvency
Subscription cost is per user. You can pay simultaneously up to 10 users.
RisCo Subscriptions offer the greatest flexibility in choosing the best services according to the needs of each user. These are structured into categories based on the type of service desired, as well as on different service contract periods: monthly, semi-annually, and annually. Check out the subscription offer for the best choices!
Similar services represent services associated with companies that allow for a better analysis of clients and suppliers. Company Contacts help you get in touch with the desired companies. Sector Studies provide an overview of an industry, the most important competitors, and the geographical distribution of companies. Company Lists allow you to attract new clients, while Import-Export services give you access to companies engaged in such activities.